Nonprofit Resources
Analyzing Key Financial Indicators: Cash Flow Ratios
In many regions of the United States, seeing treetops start to turn bright red and yellow indicates that the weather will soon get colder, and winter will come. Then we look for the first frost, the first snow — and ultimately the first sign of spring, when that lone piece of green breaks through the melting snow.
Watching the landscape for seasonal changes is similar to looking at key financial indicators for your church. If you pay attention and study the signs, you can prepare for what lies ahead.
Effective financial ratios can give your church vital insight into its financial condition and trends. In this article, we discuss how to analyze cash flow ratios, using sample ratios from the CapinCrouse Church Financial Health IndexTM (Index). You’ll learn:
- Why monitoring cash flow ratios is important.
- How to analyze different cash flow ratios to provide significant insight for your church.
- Recommended benchmarks for cash flow reserves and measures.
- How to use cash flow ratios with other ratios to gain insight into what drives certain trends.
Why Monitor Cash Flow Ratios?
Churches must have sufficient cash balances to operate. Positive net income and net asset balances won’t make up for inadequate cash reserves to fund outflows. They also won’t help the church handle months when giving is down. A church without necessary reserves will be scrambling to operate in the short term, no matter what its other balances are.
It is important to consider debt and other ratios alongside your cash flow ratios. It’s also prudent to consider upcoming capital needs that have not been accrued or paid for and the impact they would have on these ratios. For example, a church that needs to spend $500,000 on a new roof should consider this when looking at cash flow ratios and the impact pending expenditures will have on them. It’s the same decision process churches use when choosing whether to maintain cash reserves versus spending them to pay down debt or pay for construction instead of financing it with more debt.
Days Ratios
These ratios are designed to tell your church how many days of cash reserves are on hand by looking at cash from three unique perspectives. We discuss these ratios in more detail below.
Days of Operating Cash and Investments
Operating cash and investments are those resources that do not carry donor restrictions on the assets and are available for the church to spend without restrictions. This ratio calculates the days of operating cash and investments that are available to fund annual expenditures, but specifically related to very liquid assets. It only considers operating cash and investments, not other current assets and liabilities. Operating investments would exclude funds for endowment, split-interest agreements, and other non-operating purposes.
This amount is divided by the total cash expenses the church would incur. This is calculated by taking expenses, excluding the largest non-cash expense of depreciation, and adding the current debt principal. The current debt principal is added back because it represents cash spent but is not recorded as an expense in the statement of activities.
Let’s look at some sample ratios that have very different results and trends, and what this may indicate for each hypothetical church.
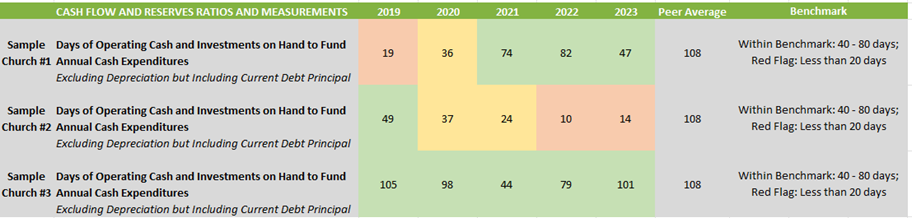 In 2019 and 2020, Sample Church #1 was outside of the recommended benchmark of 40 – 80 days of operating cash and investments.
In addition to the church’s results compared to its peers and the recommended benchmark, you can also look at the trend of the ratio between years. Sample Church #1’s trend was moving in the right direction between 2019 and 2023, when its result dropped. This may reflect a one-time event, such as a building project, expansion, or large gifts to other ministries. However, there could also be a decrease in contributions or a significant increase in expenses to the point where the church can’t fund current operations from annual contributions. Management should review this trend and make sure it is not cause for concern.
Sample Church #2’s trend is cause for concern because it shows that after 2019, its result dropped significantly and remained low. This indicates that the decrease wasn’t caused by a one-time expenditure or event — rather, it’s the result of another underlying cause. This could be a decrease in contributions or a significant increase in expenses to the point where the church can’t fund current operations from annual contributions. Most likely, it’s a combination of both. Looking at debt, contribution, and expense ratios will help this church see what is driving this trend.
You can also look to the other ratios to indicate why these results are going back and forth. Is it because the church is spending and rebuilding reserves, or are attendance and contributions fluctuating? Although you can’t discern this from the cash flow ratio alone, it’s important to understand what is causing the change between years. Looking at just one indicator instead of the combined ratios in other areas is similar to the difference between looking at a two-dimensional picture compared to a three-dimensional hologram. You get more information from the additional dimension of the hologram. The same is true when you look at several ratios and measures in conjunction with each other.
Sample Church #3 is above the recommended benchmark, but had a significant drop (that was still within the benchmark) in 2021. Upon further investigation and understanding, the church used its reserves to renovate a campus it received from another church. The church did not want to incur debt with this buildout and rebuilt its reserves over the next two years.
Analyzing the trend, benchmark, and peer information for these ratios provides significant insight. And while it doesn’t answer every question you may have, it does tell you where to look next.
Available Days of Cash Flow Coverage
This ratio is the sum of:
- How much your church has on hand at the beginning of the year that is available to spend without restrictions (operating cash and investments); plus
- The cash you will generate during the year from day-to-day operations (cash flow from operations from the statement of cash flows); plus
- Additional cash that could easily be borrowed, if needed (available operating line of credit).
This total is divided by the sum of cash expenses plus mandatory debt service payments. The result is multiplied by 365 to convert the ratio into days. The final product shows how long your church could continue to operate on these sources. It’s the maximum level of reserves and should always be the highest of the days ratios that calculate cash reserves.
Cash flow from operations typically has the biggest influence on this ratio. If a church has extremely high positive cash flows from operations, that will increase the ratio. The same is true if a church has significant negative cash flows from operations. The numerator includes prior-year operating cash and investments, which if high (or low) may increase or decrease the ratio. Finally, this ratio also includes the impact of an unused operating line of credit. If your church does not have this, your result may not be comparable to other churches that can add it to the calculation.
Think of it as how much you have on hand at the beginning of the year plus what you will generate during the current year and what you could borrow for operations. Let’s look at our examples again:
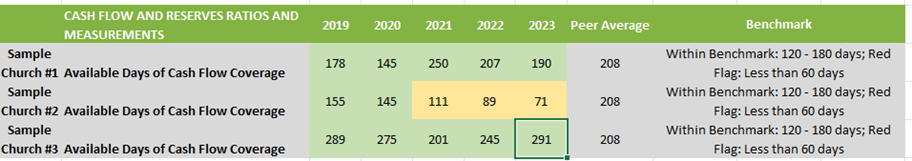
Sample Church #1 has strong results. It is within or above the benchmark each year and hovers around the peer average. However, you can see the downward trend from the peak in 2021. The question for the church is why this trend is occurring. Are there specific, identifiable expenditures that were budgeted for and expected? If not, the church should start discussing changes to correct this. If this trend continues over the long term, the ministry of the church could be permanently threatened.
The key is to know whether Sample Church #1 is intentionally making operating decisions that are keeping reserves at these levels or if the church is unaware of what is causing this trend. A church that makes intentional operational decisions that could result in growth is less worrisome than one that has no idea what is driving the trend in its reserves. Talking to management and reviewing other ratios can complete the picture.
Sample Church #2 has been outside the benchmark and below the peer average since 2021, but always above the minimum of at least 60 days of reserves on hand. When you compare this result to the Days of Operating Cash and Investments ratio, you can see that the church is able to pull this result up into the benchmark range. Although the result is below the peer average, it could be that the level of reserves is supporting certain deliberate investments in new programs or infrastructure. Comparison to the result of the Days of Operating Cash and Investments ratio further proves that the church is having challenges maintaining adequate reserves. Sample Church #2 likely has minimal cash flow from operations in the years the result is below 90 days, which means it is breaking even in its day-to-day operations.
Sample Church #3 has a very healthy trend. Not only are its results well above the peer average, but the church also is able to rebuild cash reserves after using them for specific programs or capital projects. This indicates that the church has healthy giving and manages operating expenses well. It also probably does not have significant debt. The question for this church is how it will invest these abundant resources to support future ministry growth.
All three churches require different questions, supported by ratio results.
Liquidity Ratio
This ratio measures how well operating cash and investments can cover current operating liabilities. The calculation is similar to the Current ratio, except that it is only calculated on a portion of current assets (operating cash and investments). This is not the same as all cash and investments because it excludes cash and investments that support donor restrictions.
And like the Current ratio, this modified asset amount is divided by modified liabilities. Operating liabilities (those due in less than 10 days) exclude current building fund liabilities, which normally have a separate source of cash from revenues with donor restrictions. They also exclude any amounts owed on a short-term construction line of credit as these are typically interest-only until converted into long-term debt and paid over time. As a result, a short-term construction line of credit does not require payment from current operating cash or investments.
This ratio will tell the reader how many times operating liabilities can be funded from operating reserves. We believe a reasonable benchmark for this measure is greater than or equal to 5.0.
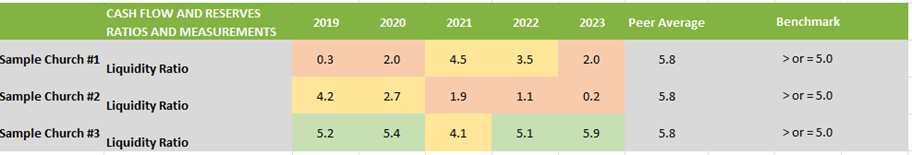
Sample Church #1’s results are trending down and below the recommended benchmark. This likely decreased between years due to an increase in operating liabilities. The church may have chosen to use resources in other ways (such as to pay off debt, which is a non-operating liability) and used its operating cash and investments to do so. In that scenario, operating liabilities could have increased because non-operating liabilities decreased.
Sample Church #1 must carefully manage its operating reserves and make sure they increase at a rate greater than operating liabilities to improve this ratio. This will require careful cash forecasting and management, which the church’s other cash flow ratios and measures indicate it is doing. This church needs to keep a close eye on trends in these ratios in the future.
In Sample Church #2’s results, the main factor that stands out is the trend. While the results are below the recommended benchmark, the biggest concern is that the result has decreased every year until the church had a 0.2 in 2023. This indicates that not only is Sample Church #2 unable to handle unexpected operating expenses, events, and new ministry opportunities that may come along, but it also is unable to handle the current expenses necessary to operate on a day-to-day basis.
Sample Church #2 appears to have used all its reserves and needs to drastically cut expenses to an absolute minimum to survive on current income. The most likely place to make cuts is in staffing, which is typically a church’s largest expense. However, while reducing staff may help Sample Church #2 survive in the short term, it won’t help over the long term and will severely impact the church’s ability to provide programs and services on an ongoing basis. It’s a tough place for a church to be and Sample Church #2 is likely looking at closing or combining with another church.
Sample Church #3’s results are very strong and above the benchmark in every year except 2021, which is not far below the benchmark. As you compare this ratio to the other cash flow ratios and measures, there is no cause for concern at Sample Church #3.
Net Cash Availability
This measurement calculates the amount of cash available for other uses after the church has satisfied its current liabilities and set aside appropriate funds for projects with donor restrictions that have not been completed. It is one of the most important measures provided to your church leadership because it answers the question “Whose cash is it and how much of it can we spend?” not “How much cash do we have?” These are typically two very different questions.
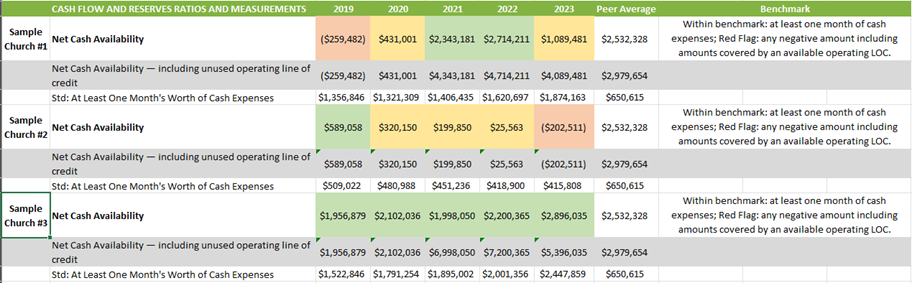
Sample Church #1 has wavered above and below one month’s worth of cash expenditures. Unlike Sample Church #2, however, it appears to have a plan to handle the fact that it is consistently going below the benchmark. The measure reflects that in 2021, Sample Church #1 took out a $2 million operating line of credit and increased it to $3 million in 2023. So, while the church’s net cash availability is below one month’s worth of expenses, with the availability of the operating line of credit it is within the benchmark. This is only a safety net, and by actively monitoring reserves and forecasting cash flow, Sample Church #1 appears to be managing its operations.
Sample Church #2’s results are negative, which is below the benchmark of one month’s worth of cash expenditures. The trend is also concerning because the church is increasingly spending money it does not have, and the result appears to be growing exponentially. So how is this church able to go so far negative? It’s likely that because other resources aren’t available, Sample Church #2 spent resources with donor restrictions to fund operations. These resources are not to be expended for general operating purposes, which is why they are excluded from the subtotal of net cash available for spending. A negative result indicates the church has likely spent resources with donor restrictions. There can be an obligation to the donor if a church misspends its net assets with donor restrictions.
A negative result can also indicate that a church may be funding operations with short-term revolving debt. You can tell that Sample Church #2 isn’t doing that because its Net Cash Availability measure is the same with and without the operating line of credit, indicating that the church does not have one. But it’s clear the church has “borrowed” from resources with donor restrictions and doesn’t appear to be able to pay them back.
Sample Church #3 is well ahead of peers, above the benchmark, and has consistently increased cash available to spend on operations. You can tell Sample Church #3 manages its cash reserves and is forecasting cash needs because the ratio shows that in 2021, it obtained a $5 million operating line of credit, which the church decreased to $2.5 million in 2023. While Sample Church #3 doesn’t appear to need it, the church is covering itself with a one-month expense reserve through revolving debt.
You can also see that Sample Church #3’s average monthly expenses are increasing. Since the largest two expenditures in most churches are personnel and debt, the church is likely growing and expanding its programs and operations. It’s probably a combination of these factors. To know for sure, you would need to analyze the church’s debt and personnel expense ratios along with attendee trends. However, the key is that Sample Church #3’s reserves are growing and expanding as its operations do the same.
Just like noticing the leaves changing in the fall, if you know what to expect and can read the signs, putting these metrics together can provide a comprehensive examination of your church’s cash reserves, which can be very valuable to your church leadership.
If you want to benchmark your church but are unsure where to start, ask us about the CapinCrouse Church Financial Health Index. This convenient online tool is designed to help churches measure and analyze financial strengths, weaknesses, and trends to see where they have been and map the best route forward.
This article has been updated.

Nathan B. Davis
Nathan Davis is a Partner at CapinCrouse. Nathan has almost 15 years of experience providing auditing and accounting services to various nonprofit entities, including churches and denominational entities, colleges and universities, private schools, and international mission organizations. He is responsible for the oversight of attest engagements, the recommendation of internal control structures and best practices, and ensuring that the team is communicating well with client personnel to facilitate efficient and effective service.